

- Once people are aware of the need to make preparations for a possible disaster, it can be very useful for them to map their community. Maps allow people the opportunity to look at their whole community and consider things in different ways. Maps can help show how certain things may be linked; for example, poor housing on land that often floods, or wells built near the homes of wealthy people. Maps drawn by different groups, such as men, women or older people, may reveal some interesting differences.
- Maps can either be drawn on the ground, using sticks, leaves and stones to represent things or with large sheets of paper and pens. People should be encouraged to note natural features such as rivers, water sources, raised ground and large trees, as well as clinics, schools, churches, houses or roads. They should also note places where there may be a particular risk, eg: weak bridges, open wells, steep slopes at risk of landslides.
- Encourage the participants to relax and allow everyone to share their views within each group. Once each group has finished, provide time for all groups to present their maps and to allow discussion.
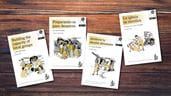
Tools and guides
Community mapping
A participatory activity to help with community-level planning
2005 Available in English, French, Portuguese and Spanish
Discussion
- Set aside a day to carry out community mapping. This exercise is best done with groups of between 10 and 20 people. Different ages, and men and women may have very different ideas. Either use mixed groups, or allow several different groupings of people to draw their own maps. For example, young people, married women, men and elders could all produce maps.
- What might be the positive results of carrying out community mapping?
- Why do different age groups and men and women mention different points on their maps? How can different observations be combined? Whose viewpoint and observations are most important?
- How should the findings be shared and used?
- Are there any things that only one group identifies? What are these? Why are some groups more likely to notice certain things?
Similarly Tagged Content
Share this resource
If you found this resource useful, please share it with others so they can benefit too.

Get our email updates
Be the first to hear about our latest learning and resources
Sign up now - Get our email updatesRelated Resources
-
The Mwanalundu disaster risk reduction project
Over recent years the Mwanalundu river in southern Malawi has gone through a cycle of flooding and drying up
-
Online courses
Humanitarian principles and the local church (short course)
A self-led online course on how the local church can put the four humanitarian principles into practice during a disaster response
Available in 2 languages
-

Research reports
Bridge builders: Strengthening the role of local faith actors in humanitarian response in South Sudan
A two-way model of sharing capacity and strengthening a localised response
Available in 1 language
-
The Mwanalundu disaster risk reduction project
Over recent years the Mwanalundu river in southern Malawi has gone through a cycle of flooding and drying up
-
Online courses
Humanitarian principles and the local church (short course)
A self-led online course on how the local church can put the four humanitarian principles into practice during a disaster response
Available in 2 languages
-
Research reports
Bridge builders: Strengthening the role of local faith actors in humanitarian response in South Sudan
A two-way model of sharing capacity and strengthening a localised response
Available in 1 language
